Simple Plotting in MATLAB
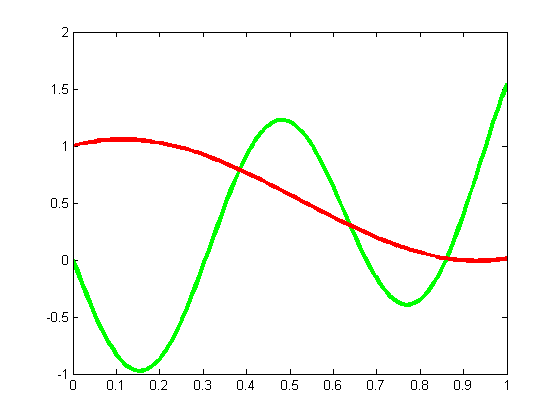
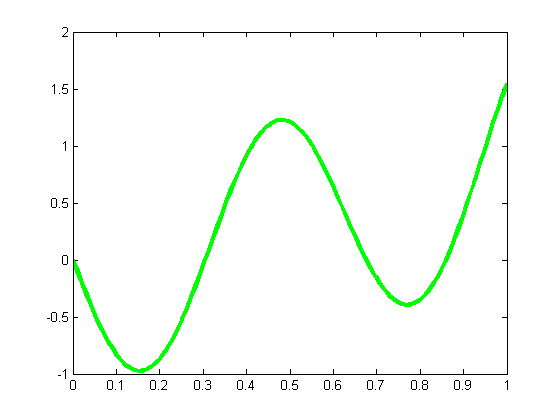
The plot command takes vector input
x = linspace(0,1,100);
plot(x, x.^2-sin(10*x), 'color', 'green', 'linewidth', 3)
Here's one way to combine several plots in one display. We can use
hold on
plot(x, x+cos(3*x), 'color', 'red', 'linewidth', 3)
hold off